Nominally two-dimensional flows can exhibit three dimensional characteristics when separated. Researchers (Gregory, et al., 1971; Winkelman, et al., 1980; Moss, et al., 1971; Broeren, et al., 2001) describe three-dimensional structures known as stall cells, owl-face structures or "mushrooms" on the suction side of wings that experience trailing edge separation or a combination of leading edge - trailing edge separation.
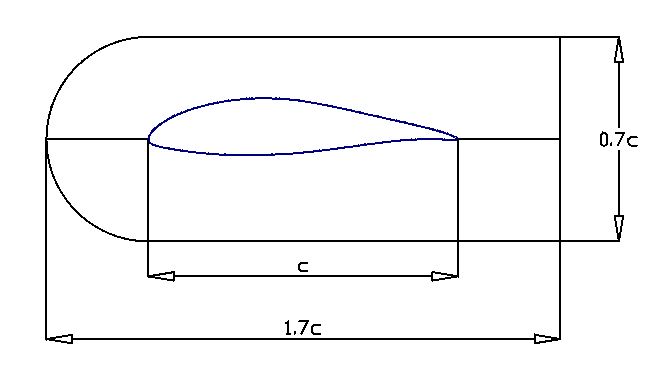
The wing model had a chord of 0.6m and spanned the test section vertically, a distance of 1.4m. The width of the test section was 1.8m, so that this model orientation minimized the blockage. The solid blockage of the model was 6.9% of the tunnel section at 12 degrees angle of attack and reached a maximum of 9.2 % at the highest angle, 16 degrees, still below the 10% limit (Barlow, et al., 1999 ).
Flow visualization of 3D separation on a plane rectangular wing
Wing flow visualization experiments were conducted at the National Technical University of Athens (NTUA) wind tunnel to better understand the nature of three-dimensional separation on a plane rectangular wing. Τurbulence intensity in the test section was 0.2%
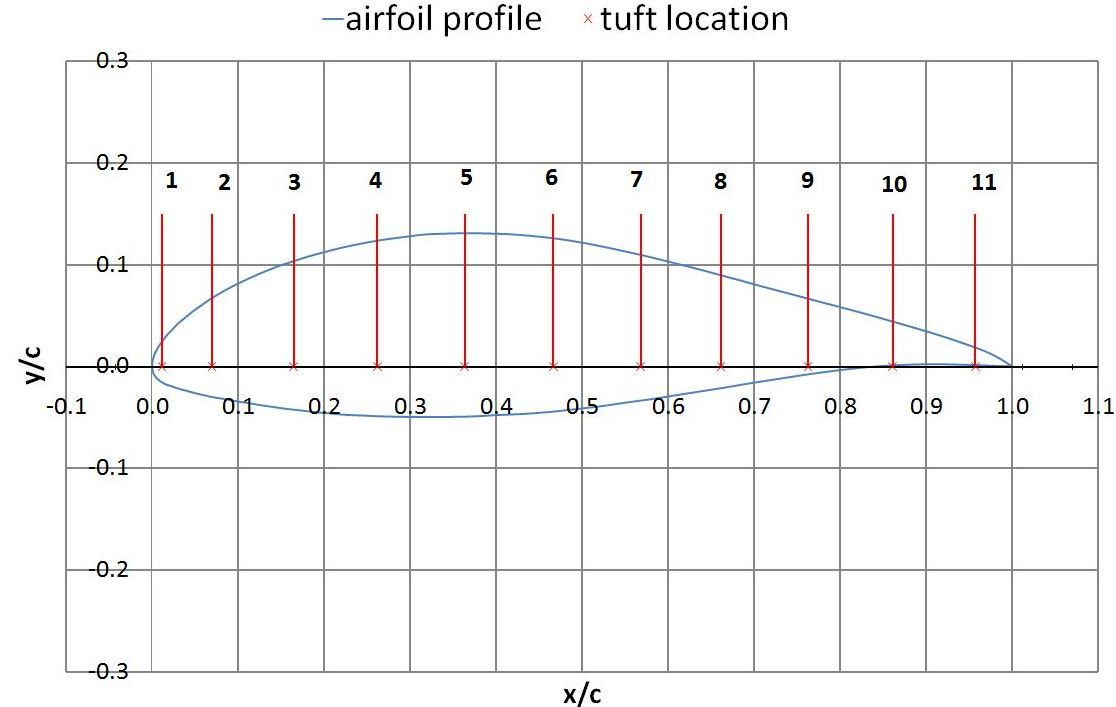
The airfoil profile used was optimized for use in a 5MW horizontal axis wind turbine (Mourikis, et al., 2005). It has a maximum thickness of 18% and experiences trailing edge separation. For the classification of airfoil sections according to stalling characteristics see (Bak, et al., 1998).
Fig. 1
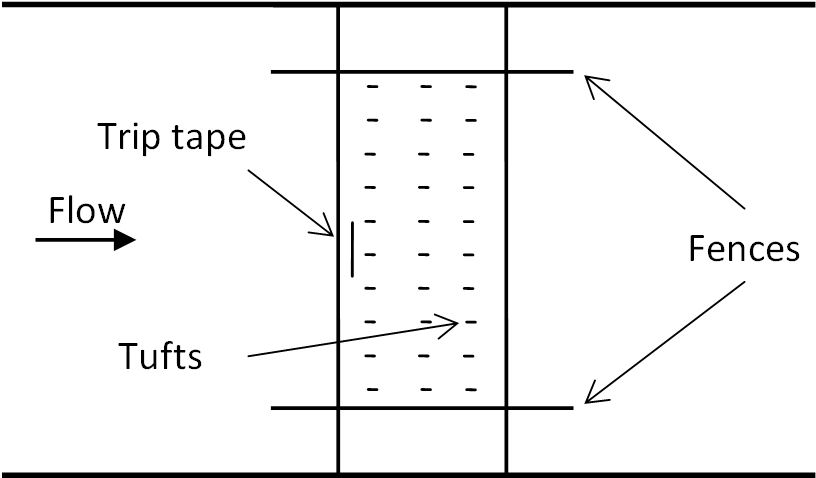
To minimize the wind tunnel boundary layer effect and at the same time control the wing aspect ratio we used two fences, shown in Fig. 1, which could move along the model span, see Fig. 2.
Fig. 2
The suction side of the model was fitted with No.60 sewing threads in spanwise rows with 4cm spacing between them. The chordwise position of the tufts is shown in Fig. 3. Every single tuft was individually taped on the model surface to minimize their interference to the boundary layer and to allow easy replacement in case of a tuft or tape being damaged. At each test case (Re, AR, α, tripping) we filmed the tufts and analyzed the results from the videos taken.
Fig. 3